Where to go next?
This is part II of a trilogy of posts on using the Pentaho Business Analytics platform to do Business intelligence on real-time sources as rapidly as possible (it took me longer to write the first post I that it did to build the solution!). If you have found this article from elsewhere I'd suggest reading part I first, which is available here:
In Part I I implemented a simple report as part of a dashboard using a PDI transformation as a data source. I'd also like to point out that I'm not the first person to do this, nor is this aspect of the solution a new Pentaho feature, this has been around since 2011, as shown here by Wayne, Using a Pentaho Data Integration Data Source with the Pentaho Report Designer. In part II I'm going to expand this to show how a second detail level drill-down can be created passing parameters into the transformation to control the search. Part III goes on to use some Pentaho 5.0 features.
Part II starts off by creating a new transformation to retrieve and process the detail level data for one specific line. After creating a new transformation the transformation properties are modified by adding a parameter. In this case I've added two, one for the URL of the detail level service URL and one for the line that I'm interested in.
The first part of the transformation repeats the call to the line status API, but gets back more detail on the service, in parallel with this it fetches the summary level detail for the individual line, this lists information for individual trains and stations on a line.
Again there are a few steps to trim byte order marks etc. There is a database look-up step to get the color formatting for the line from the same database. In addition in this case the second detail level look up requires a line code. These are published by TfL in their developer guides available here. I have also put these into a database. The query URL is then constructed and passed to a second HTTP request. This generates a large XML response where I use a Get Data From XML step to break out the values I'm interested in. In this case I loop on the "/ROOT/S/P/T" element and then use XPaths to get the fields I need inside and outside of the looping element.
Platform and Station are one level and two levels back from the looping element. This then creates one data row for each train active on the line. I then join this stream with the line status information that I have from the earlier call. This is then followed by a slightly odd section...
Filter Ghost stations? I was a little confused when I first looked at the data and found that there were stations appearing on the Bakerloo line and Central line that were listed as having overground services. A little bit of investigation discovered something a little strange, there are many stations that used to be part of the underground, but for one reason or another are no longer part of the underground network, details are available here. Why a station that ceased to be part of the underground in 1982 is still appearing in an API query for that line I haven't been able to work out.
If you are interested in some of the more bizarre aspects of the London Undergrounds missing and closed station there is an excellent website dedicated to this topic underground-history.
A little bit of further tidying of the data was required for the predicted arrival time, the default for "in the station" is a '-' character, and as I wanted to sort by arrival time this was not much use, so I replace this with "00:00". The next steps just sort the trains by arrival order and filter this down to just the next three arrivals.
Line Status Report
This dashboard panel will again use a PRD report to display the data. The complexity in this case, aside from rather more data, is passing a parameter to the transformation. In this case I create a parameter "Line". In the Pentaho data Integration Data Source popup there is an Edit Parameter button.
This just links the name of the parameter as it is known in the report to its name in the transformation parameters. I then added the data fields to the report, did a bit of manual styling linked in the line status details, station names etc
To make this report work in a pair with the report created in Part I as part of the dashboard, a minor modification was needed to the first report. The Pentaho EE dash boarding has a capability to very easily link dashboard widgets using parameters and content linking. To access this in a PRD report you need to add a hyperlink from the cell that will be the drill-down link. The link itself will be intercepted, so doesn't actually hit it's end point, but I used:
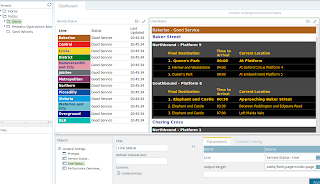
So at this point I have two transformations and two reports. All that remains is to edit the dashboard, drag and drop in the second report, enable content linking from report one and attach this as a parameter to report two. The refresh can be left on the individual panels or moved to the dashboard level.
So the dashboard at the end of Part II looks like this:
Clicking on the line in the left hand report changes the line listed in the right hand panel. In Part III I'll show a very simple example of how this real time data can be stored in Cassandra and queried using a Mondrian Analyzer view.


Another great post!
ReplyDelete