Tuesday, 29 October 2013

Agile Real Time BI with Pentaho - Part II

Where to go next?

This is part II of a trilogy of posts on using the Pentaho Business Analytics platform to do Business intelligence on real-time sources as rapidly as possible (it took me longer to write the first post I that it did to build the solution!).  If you have found this article from elsewhere I'd suggest reading part I first, which is available here:
In Part I I implemented a simple report as part of a dashboard using a PDI transformation as a data source.  I'd also like to point out that I'm not the first person to do this, nor is this aspect of the solution a new Pentaho feature, this has been around since 2011, as shown here by Wayne, Using a Pentaho Data Integration Data Source with the Pentaho Report Designer.  In part II I'm going to expand this to show how a second detail level drill-down can be created passing parameters into the transformation to control the search.  Part III goes on to use some Pentaho 5.0 features.

Part II starts off by creating a new transformation to retrieve and process the detail level data for one specific line.  After creating a new transformation the transformation properties are modified by adding a parameter.  In this case I've added two, one for the URL of the detail level service URL and one for the line that I'm interested in. 

The first part of the transformation repeats the call to the line status API, but gets back more detail on the service, in parallel with this it fetches the summary level detail for the individual line, this lists information for individual trains and stations on a line.  
Again there are a few steps to trim byte order marks etc.  There is a database look-up step to get the color formatting for the line from the same database.  In addition in this case the second detail level look up requires a line code.  These are published by TfL in their developer guides available here.  I have also  put these into a database.  The query URL is then constructed and passed to a second HTTP request.  This generates a large XML response where I use a Get Data From XML step to break out the values I'm interested in.  In this case I loop on the "/ROOT/S/P/T" element and then use XPaths to get the fields I need inside and outside of the looping element.
Platform and Station are one level and two levels back from the looping element.  This then creates one data row for each train active on the line.   I then join this stream with the line status information that I have from the earlier call.  This is then followed by a slightly odd section...
Filter Ghost stations? I was a little confused when I first looked at the data and found that there were stations appearing on the Bakerloo line and Central line that were listed as having overground services.  A little bit of investigation discovered something a little strange, there are many stations that used to be part of the underground, but for one reason or another are no longer part of the underground network, details are available here.  Why a station that ceased to be part of the underground in 1982 is still appearing in an API query for that line I haven't been able to work out. 

If you are interested in some of the more bizarre aspects of the London Undergrounds missing and closed station there is an excellent website dedicated to this topic underground-history.  
A little bit of further tidying of the data was required for the predicted arrival time, the default for "in the station" is a '-' character, and as I wanted to sort by arrival time this was not much use, so I replace this with "00:00".  The next steps just sort the trains by arrival order and filter this down to just the next three arrivals.

Line Status Report

This dashboard panel will again use a PRD report to display the data.  The complexity in this case, aside from rather more data, is passing a parameter to the transformation. In this case I create a parameter "Line".  In the Pentaho data Integration Data Source popup there is an Edit Parameter button.

This just links the name of the parameter as it is known in the report to its name in the transformation parameters. I then added the data fields to the report, did a bit of manual styling  linked in the line status details, station names etc
To make this report work in a pair with the report created in Part I as part of the dashboard, a minor modification was needed to the first report.  The Pentaho EE dash boarding has a capability to very easily link dashboard widgets using parameters and content linking.  To access this in a PRD report you need to add a hyperlink from the cell that will be the drill-down link.  The link itself will be intercepted, so doesn't actually hit it's end point, but I used:

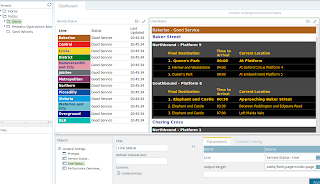
 So at this point I have two transformations and two reports.  All that remains is to edit the dashboard, drag and drop in the second report, enable content linking from report one and attach this as a parameter to report two.  The refresh can be left on the individual panels or moved to the dashboard level.


So the dashboard at the end of Part II looks like this:
Clicking on the line in the left hand report changes the line listed in the right hand panel. In Part III I'll show a very simple example of how this real time data can be stored in Cassandra and queried using a Mondrian Analyzer view.

Friday, 25 October 2013

Agile Real Time BI with Pentaho - Part I

A change of direction

Back in June I changed direction in my career and moved from being a business architect trying to deliver business benefit at a large media and publishing house to a pre-sales engineer for Pentaho.  I'd used the community edition of Pentaho quite extensively in the past, so now I've moved on to using the Enterprise Edition to show the possibilities of using a modern plug-able business intelligence platform.  

One of the interesting aspects of my role is visiting trade events and shows giving live demonstrations, showing how we can solve problems on the fly with our technology.  While most people are in the talks, the rest of us on the trade stands have an opportunity for some downtime.  This also gives a great opportunity to put together some new technical demos.  Last week I was at the Cassandra Summit Europe 2013 in London and took the opportunity of an hour or so's downtime to put together a small technical demo.

Agile Real-time BI

Trying to come up with a sensible test case for real-time BI is often a significant stumbling block, but in this instance I took inspiration from the work that Matthew Summerville did on a live London underground map.  Transport for London have an API available with various data sources, this is free to register for and access.

TFL Service Status
The choice of technology in this instance is Pentaho Business Analytics, both the BA server and Data Integration.  I'm using the Enterprise Edition in this case, but most of the functionality needed is in the community edition as well.  Most of the data I'm planning on pulling live but where I need data storage I'll use Cassandra.

The objective that I've set myself is to create three report components:
  1. A report similar to the the TFL service status report
  2. A drill in detail report showing the arrivals at each station
  3. An analytic view of real-time and historic data.
In this post I'll cover component one and I'll followup with parts 2 and three.

The starting point for the service status is an outline architecture.  One method of producing a report component with tight control over the visual appearance is to use the Pentaho Report Designer.  Looking at the options for the  real-time data acquisition for this component, one option is to use a PDI transformation as a data source.  So that's where we're going to start.


Real-Time data acquisition in PDI

The TfL API can be accessed by a HTTP client and will return XML.  PDI has a couple of HTTP clients for Web-Services (SOAP), RESTful interfaces and general purpose HTTP clients, in this instance I'll use the HTTP client.  The HTTP client on it's own will not generate any data rows, you have to add a step before the look-up to generate at least one row.  In this case it would be useful to know the query time anyway, so I'll use the Get System Info step to get the current time.

To this gives us:
The get system info step is used to get the system time:
The connection to the Tfl API is quite simple, just connect and get the line status:

One complication at this point is that you might get a BOM (byte order mark) tacked on the front of the response.  On Windows I found this to be 3 characters and on Linux 1.  As a simple work around I used a simple OpenFormula step.  The next part is to extract the interesting fields using the Get XML Data step.
This extracts the Line and Status fields from the XML as separate data fields in the stream.  I also added a database look-up step to retrieve some color formatting data for the report.  TfL publish a style guide where they specify the color scheme of foreground and background for each line.  So the final transform is:

A dashboard report in Report Designer

The desktop report designer tool is an hugely powerful tool for creating visually rich report components.  While the tool is used extensively used for creating inventory reports an invoices destined for print its flexibility lends it to being suitable for a wide range of purposes.  This flexibility starts from the supported data sources.  These range from simple SQL statements, dynamic queries, metadata repository queries, PDI transformations and from version 5.0 MongoDB.   In this instance I'll use the PDI transformation that I just created.  

When creating a new data source in PDI there is an option to use "Pentaho Data Integration", this opens a dialog where you set a query name and specify the path to the transformation file.  This will then read the transformation and list the steps available to use as the source of the data for the report.  It is also possible to add parameters to filter data from the report.
By dragging and dropping the available data fields into the report you can create the layout that you want.  Each component on the report can have all its parameters set statically in the tool or dynamically from a data source.  In this case I'm going to use the foreground color and background color from the query to style the report elements.   

In this case I've set the text color to the value of the data field "foregroundcolor".  All that remains to do now is style the remaining components and preview the report.
That's our finished report, all that remains to do now is add this into a dashboard.  Firstly you need to publish the report to the BA server, once the report is there in the EE edition you can create a new dashboard page and drag and drop the report element into place.  
In the dashboard designer the refresh interval can be set.  In this case I use 60 seconds.  So every 60 seconds the dashboard element is refreshed, where the report is redrawn and the data source queried, in this case our PDI transform bringing real-time data into the dashboard.  

So I now have a dashboard element that updates every 60 seconds querying and displaying real time data.  In my next post I'll look at how this report can be linked to a detail drill-down to show the status of each line.  This whole exercise should have taken no more than an hour even for a PDI and Pentaho reporting novice, you cant get much more agile than that!